
KoggerApp

A sonar is half a survey. This is the other half.
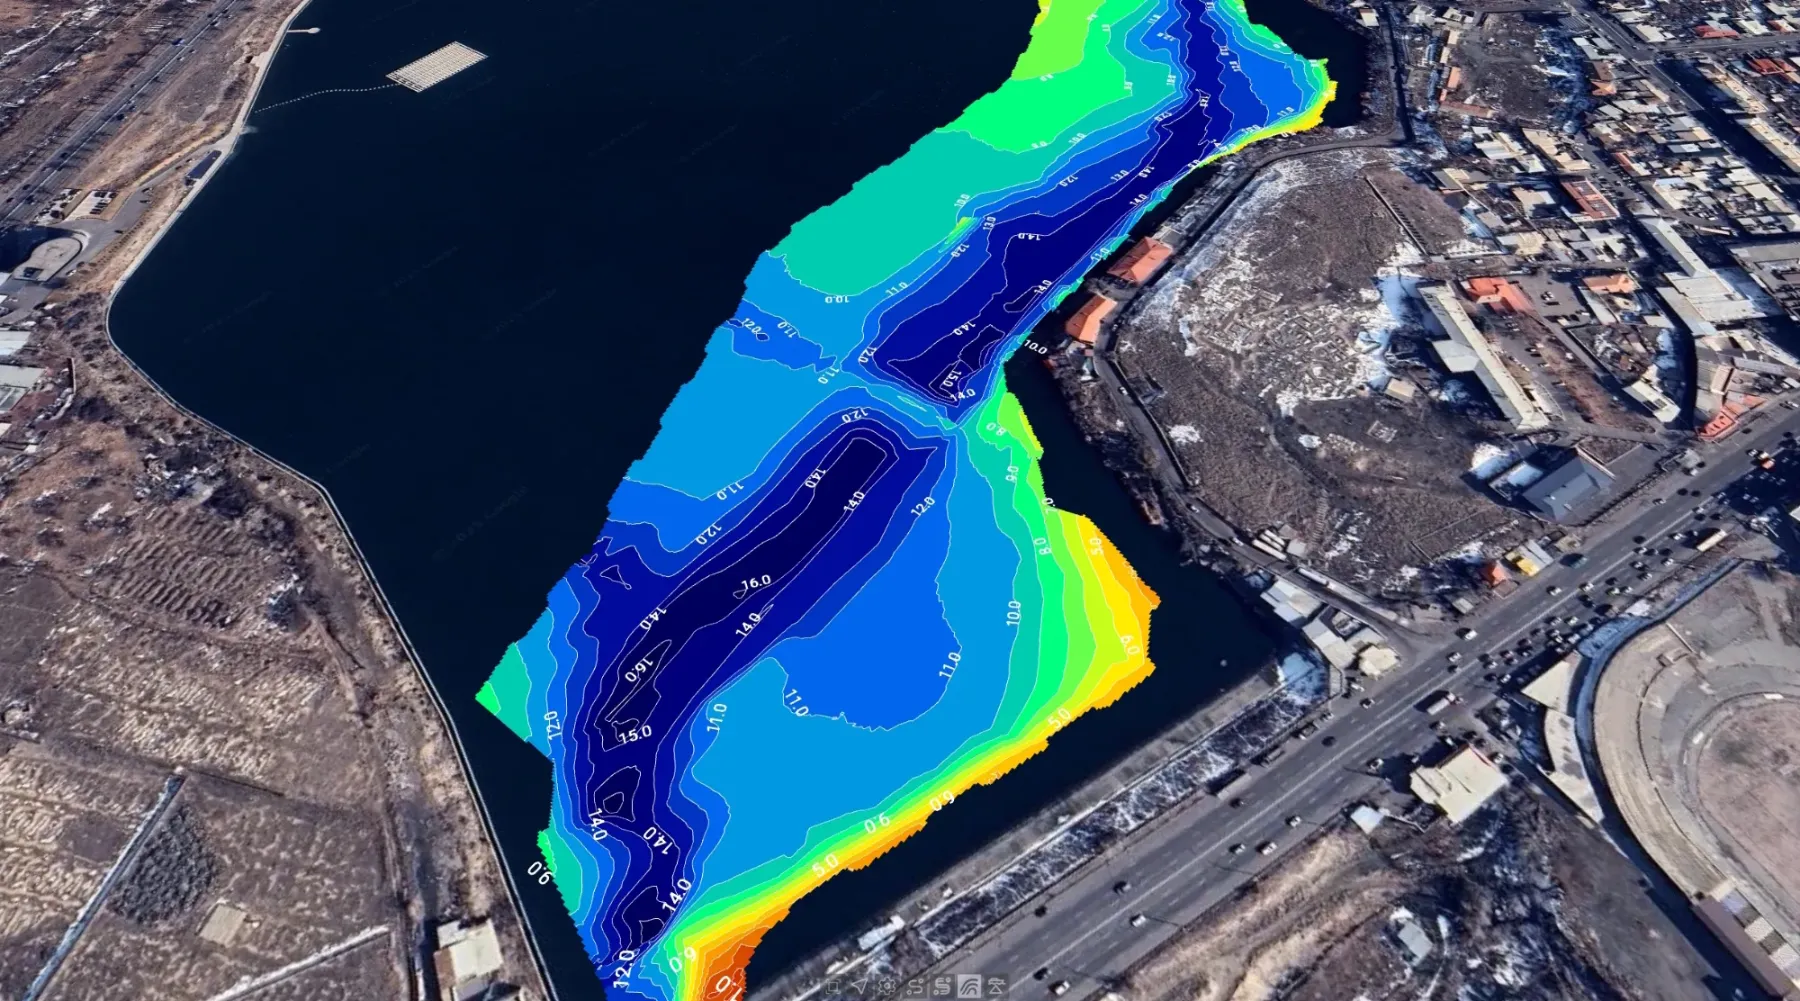
Connect a Kogger sonar and three layers build themselves while you are still on the water: a high-detail echogram, live isobaths and a side-scan mosaic, all on one georeferenced map. Nothing to post-process before you can see what you just passed over.

Open source · GPL-3.0
Live while you drive Windows · Android · Linux Open formats
Scroll
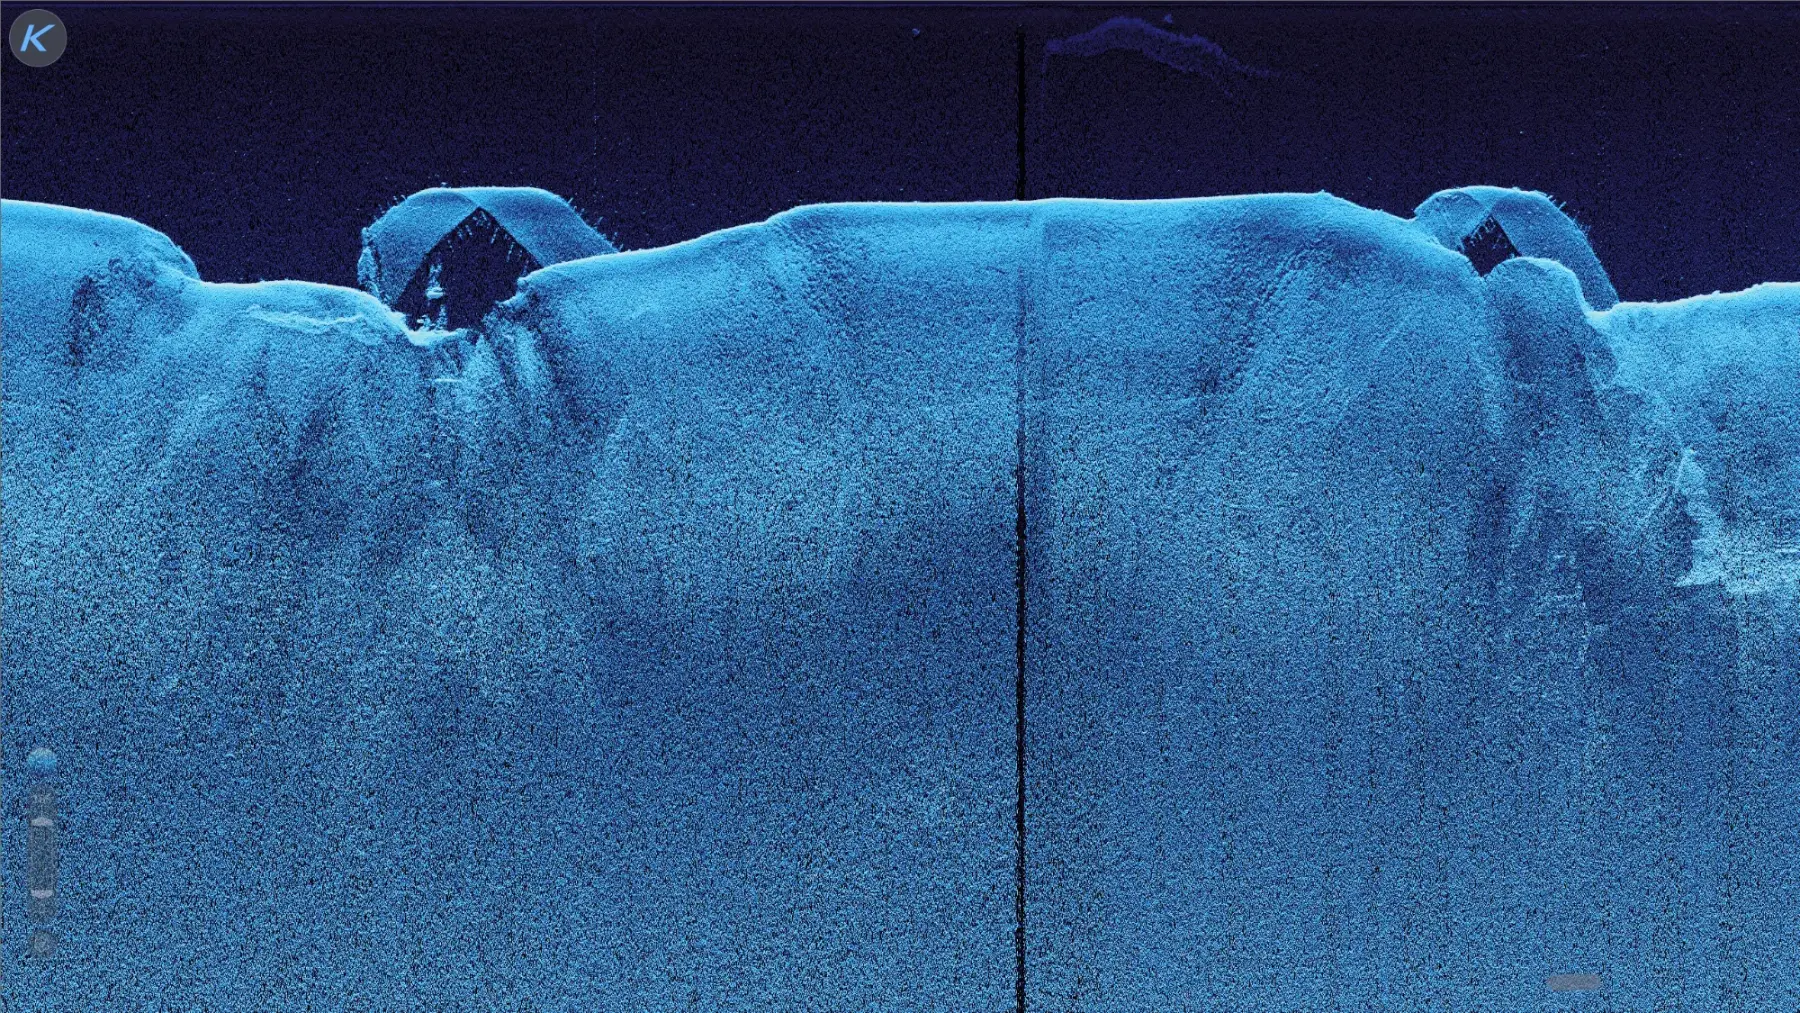
High-detail echogram: the water column, the bottom return and two channels stitched at the centre seam
Isobaths with labelled depths, computed live and laid over the satellite map of the survey area
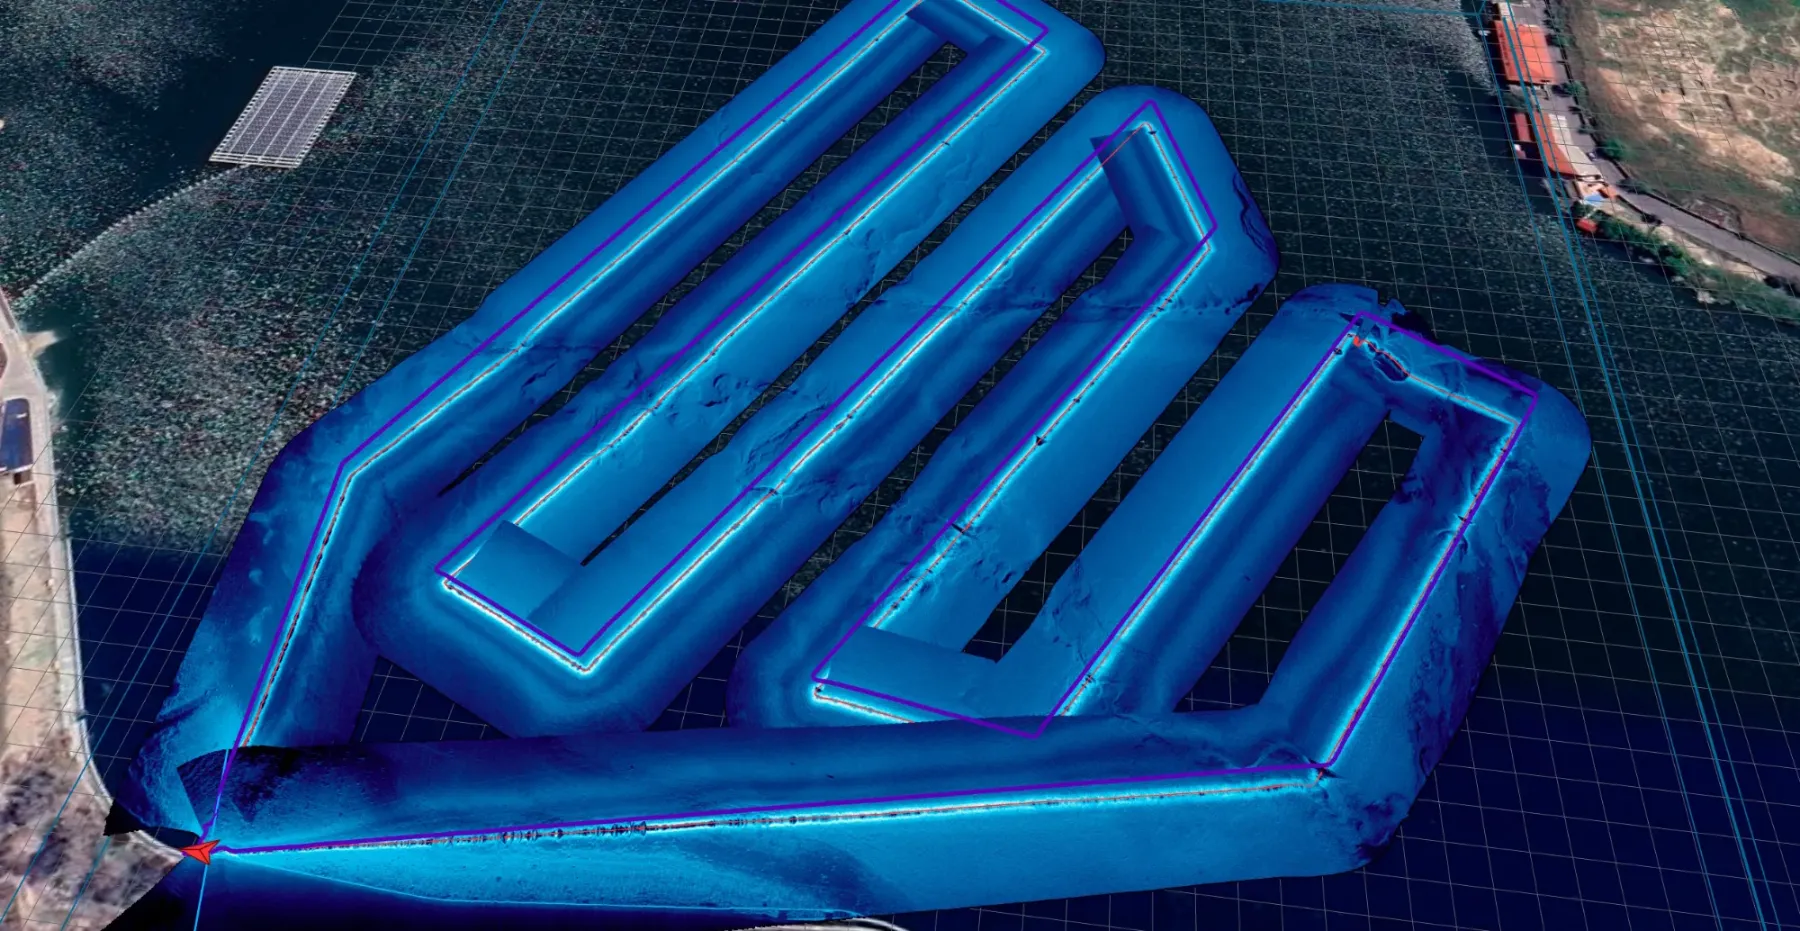
Side-scan mosaic of the whole survey, georeferenced on the map with the lawnmower track drawn over it
Swipe to change layer

Three live layers, one map

Real time

Echogram

The water column and the bottom return, drawn ping by ping.

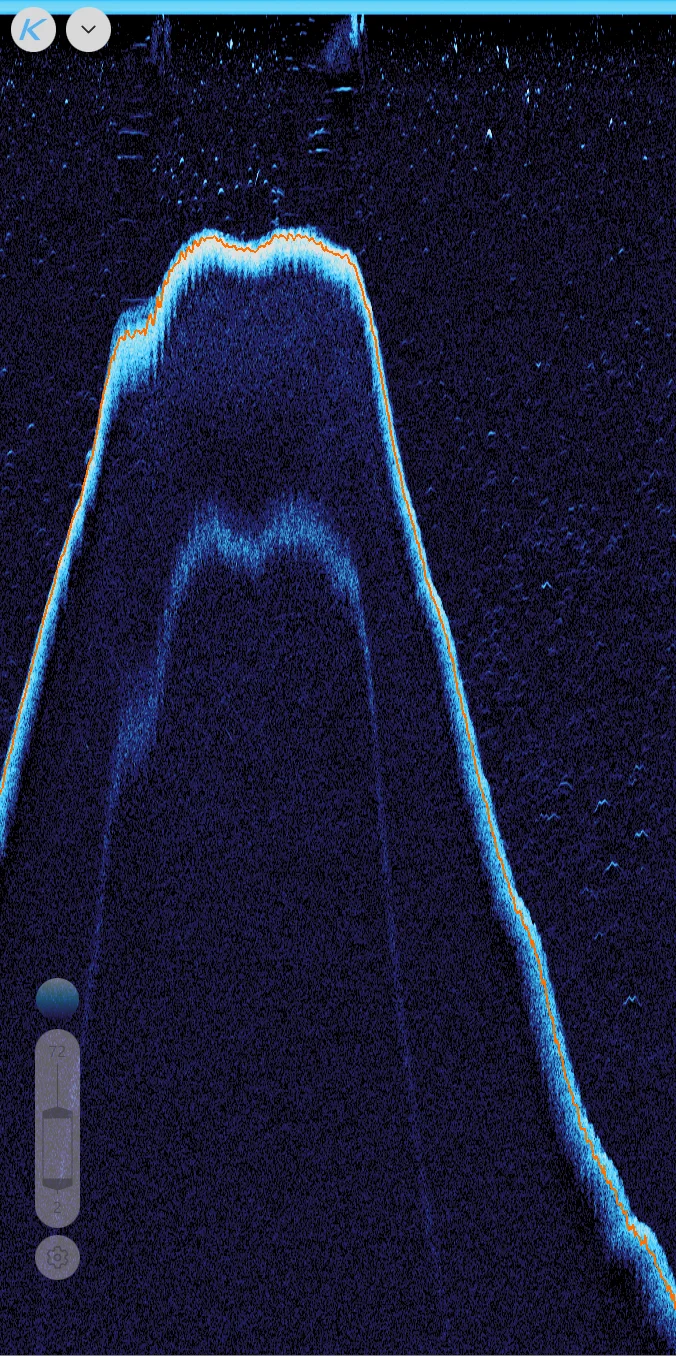
Detail high enough to read structure, not just a depth number. The bottom is detected automatically and the depth computed from the raw acoustic data — two channels at once when you run down-view and side-view together.

Real time

3D isobaths

Contours of the bottom, recalculated while you are still driving lines.

The shape of the basin fills in as you cover it, so thin coverage is obvious while you can still go back over it. Contours follow the bottom surface — corrections show up straight away.

Real time

3D side-scan mosaic

Side-scan imagery stitched together and laid onto the map as you go.

See the object you just passed over, on the spot. Georeferenced, so the mosaic lines up with the isobaths beneath it, and growing continuously — no stitching pass at the end of the day.

01  Echogram
02  3D isobaths
03  3D mosaic
Swipe to change step

Set it up the way you work

01 · Make it yours

Move anything, anywhere

Drag a pane to a new place, pull its edge, and the rest of the window follows.

Nothing is locked down — the workspace is rearranged live, while the sonar keeps recording.

02 · Workspace

One window, any split

Panes are yours to arrange: 3D map, echogram, side-scan.

As many as the job needs, split the way you want them. Add a pane, change what it shows, drop the ones you are not using.

03 · Layouts

Save it once, switch in a tap

Keep one layout for driving lines and another for reading back what you recorded.

They travel with you: the same arrangement on the workstation and on the tablet clamped to the console.

04 · Widgets

Build your own readout

Drag the values you actually watch onto a panel of your own.

Depth, bottom track, ground speed, coordinates, battery, current, flight mode — each labelled and sized the way you want it.

05 · On the water

Readable at arm's length

The tablet is a metre away, in full sun.

Put the panel where it does not cover the view, scale the figures up, dial the background from transparent to solid.

01  Make it yours
02  Workspace
03  Layouts
04  Widgets
05  On the water

Look closer

Real recording

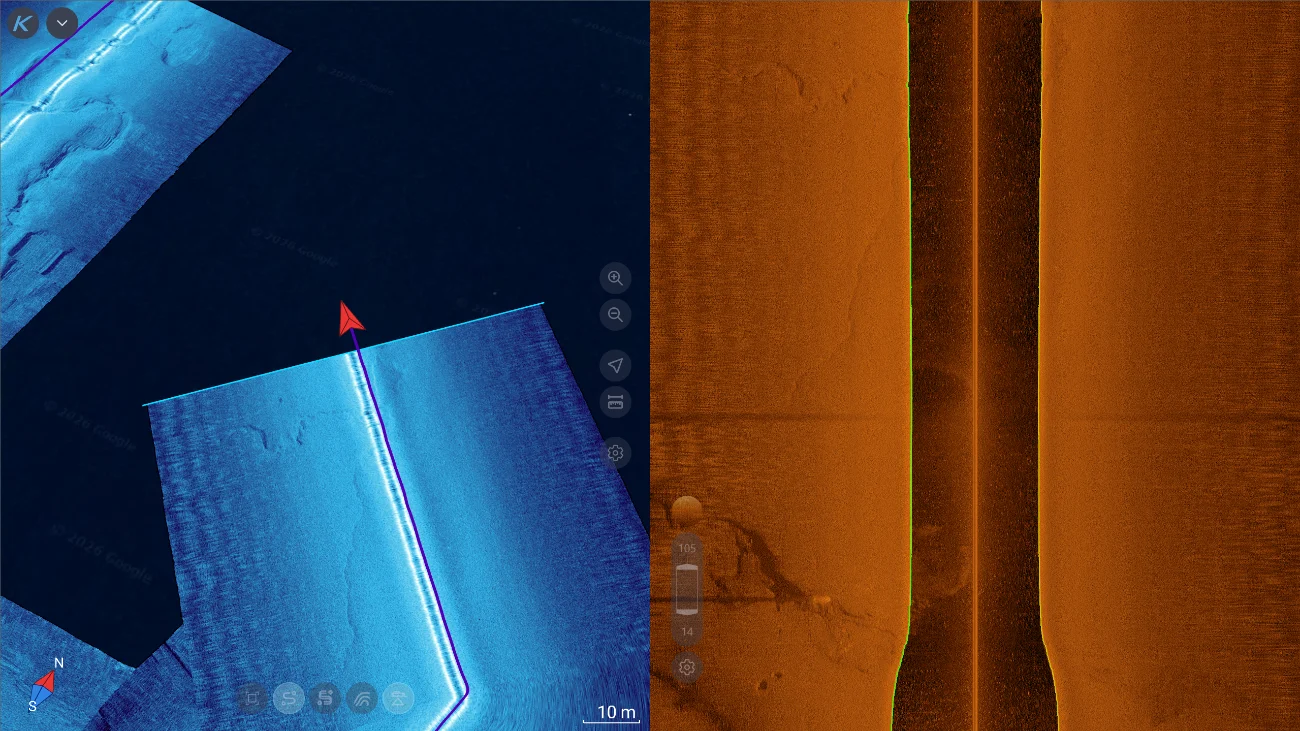
Side-scan detail: bottom texture, a linear feature crossing the swath, and the survey track drawn over the mosaic
Hover for 1:1 detail · click for full size
Side-scan detail — bottom texture at full resolution, the survey track drawn over it Recorded with a Kogger sonar

Recording

Side-scan detail at full resolution
Move to pan · click or Esc to close 1:1

Four steps

How a survey looks

01

Connect

Serial port, TCP or UDP, including over the WiFi-UART bridge. Several Kogger sonars at once. Recognised and streaming immediately.

02

Drive

Run your lines with autopilot telemetry on screen: battery level, speed, link quality. Nothing to configure between casting off and seeing data.

03

Watch it build

Echogram, isobaths and mosaic fill in on the map underneath you. Fix the bottom track where it needs it.

04

Take it with you

Bottom track and bottom surface export to CSV — for whatever GIS, CAD or reporting tool you already use.

Where it runs

Platforms

The same build, the same layouts, the same recordings — on the workstation back at the office, on a tablet clamped to the console, on the phone in your pocket when that is all you have.
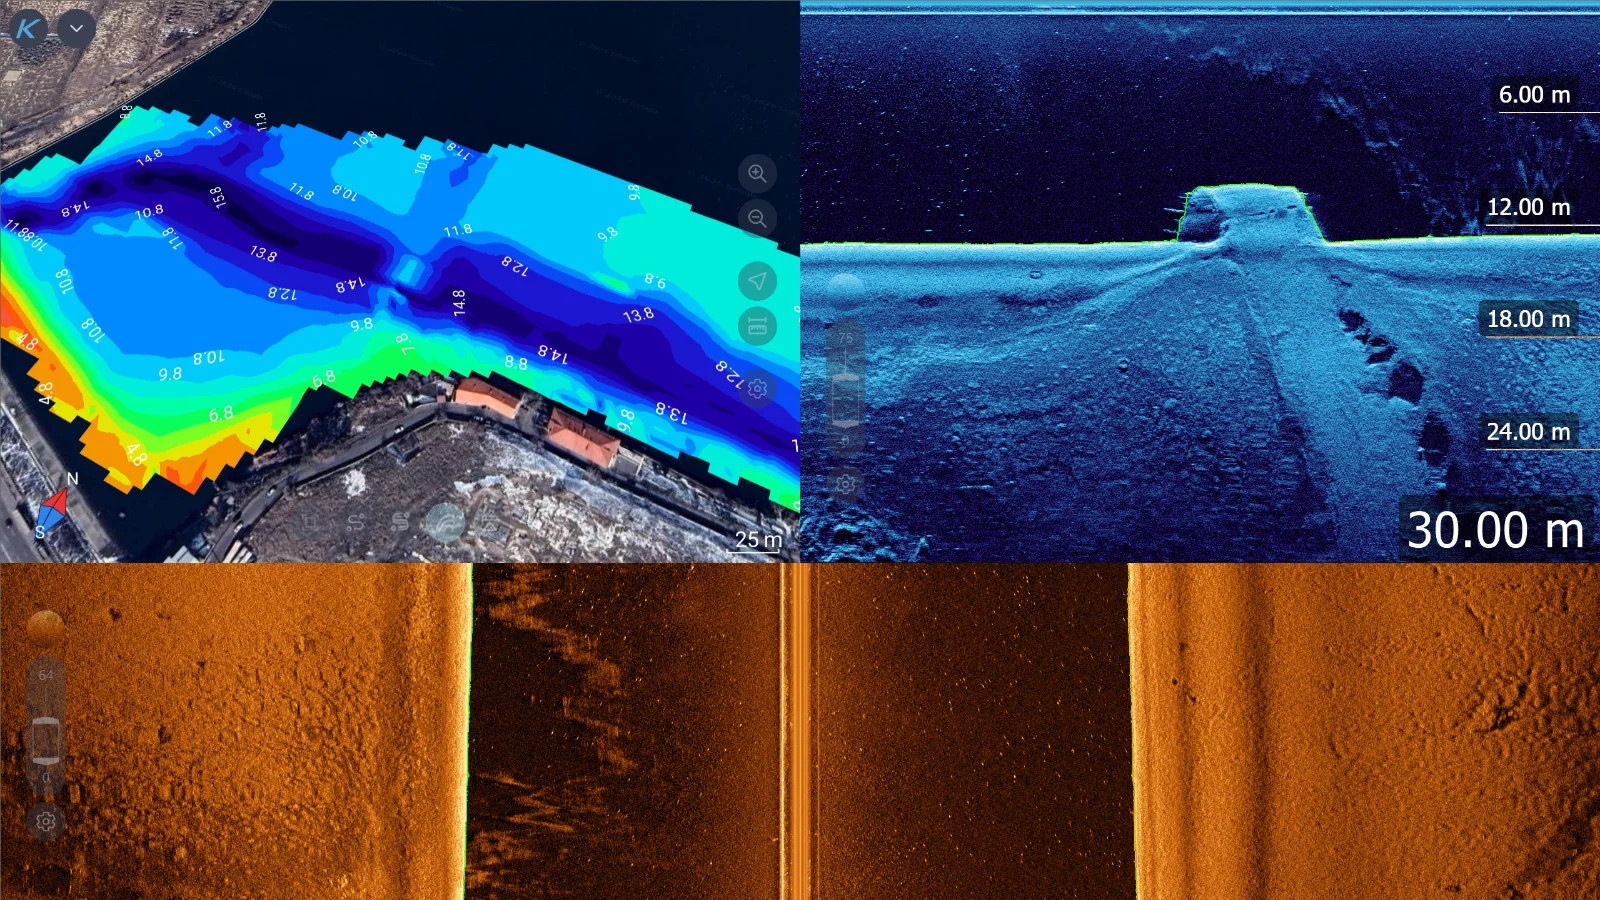
KoggerApp on a desktop: isobaths on the map, an echogram and a side-scan channel side by side

Windows · Linux

KoggerApp on a tablet: a side-scan mosaic on the map beside the raw channel

Android tablet

KoggerApp on a phone: a tall echogram with the detected bottom line

Android phone

Platform Supported versions How to get it
Windows x86_64 · Windows 10 (1809+), Windows 11 Installer, or portable .zip
Android armeabi-v7a, arm64-v8a · Android 9.0 (Pie) and above .apk from the releases page
Linux x86_64 · Ubuntu, Mint, Debian, Fedora, Arch, openSUSE and other current distributions .AppImage — make executable and run

Open source

Read it, fork it, fix it

KoggerApp is licensed under GPL-3.0 and developed in the open. You can audit it, fork it, adapt it to a workflow we never thought of, or fix a bug and send it back.

Bug reports, feature requests and pull requests are all welcome.

github.com/koggertech/KoggerApp

Is it really free?
Yes — free of charge, and free as in open source, under GPL-3.0. There is no paid tier and no feature that unlocks after payment.
Do I need an internet connection in the field?
The acoustics need nothing but the sonar link — recording, bottom detection and the mosaic all work offline. Only the background map tiles are fetched online.
Where do I report a bug?
Open an issue on GitHub, or use the support page.

Download

Take it out on the water.

Every build lives on the releases page — pick your platform and go.

Go to releases

No account, no licence key.

KoggerApp

KOGGER LLC · Armenia, Yerevan · kogger.tech
KoggerApp is distributed under the GNU General Public License v3.0